-
(9) 데이터분석_상권별 업종 밀집통계 프로젝트데이터분석 2023. 6. 14. 17:16728x90
상권별 밀집 통계 파일을 읽어온다.
import pandas as pdimport numpy as npimport matplotlib.pyplot as pltimport seaborn as sns # matplotlib 기반으로 만들어진 시각화 라이브러리shop = pd.read_csv('/content/drive/MyDrive/Colab Notebooks/Data_Analyze/shop_201806_01.csv')shop.head() shop.info()
 # dataframe의 column을 보고 싶으면 columns를 통해 불러준다.
print(shop.columns)print(type(shop.columns)) #<class 'pandas.core.indexes.base.Index'> # isnull()을 이용해서 각 data가 null이면 True, null이 아니면 False가 나온다.# isnull().sum()을 사용하면 각 column별 null의 개수를 알 수 있다.
shop.isnull().sum() # 점 그래프를 찍을 때 scatter 사용shop.plot.scatter(x = '경도', y = '위도', grid=True, figsize=(6,8))# shop을 이용해서 scatter plot을 만드는 것이기 때문에 shop['경도']등을 안하고 '경도'만 해도 된다.# grid=True를 사용하면 눈금자(?)를 나타낼 수 있다.# figsize로 plot의 크기를 조절 할 수 있다.# figsize=(가로의 길이, 세로의 길이)
 shop_seoul = shop.loc[shop['도로명주소'].str.startswith('서울특별시')]# 조건인 shop['도로명주소'].str.startswith('서울특별시')을 잘라서 보면# shop['도로명주소'] : column이 도로명주소인 것들# str: string 형태로 변환# startswith('서울특별시'): 서울특별시로 시작하는가?# 이들을 조합하면 shop['도로명주소'].str.startswith('서울특별시')을 잘라서 보면# => 도로명주소 column을 string 형태로 바꾸었을 때 서울특별시로 시작하는 것들만 가져온다는 의미이다.
shop_seoul shop_seoul.plot.scatter(x = '경도', y = '위도', grid=True, figsize=(10,8))# 서울특별시로 시작하는 것들만 scatterplot으로 만들었을 경
 # seaborn을 이용한 점 그래프 그리기plt.figure(figsize=(14, 10))sns.scatterplot(data = shop_seoul, x='경도', y='위도', hue='시군구명') #hue는 분류기준이다.
 # column명이 상권업종대분류명에 속하는 요소들 중에서 각 요소별 개수를 보고 싶을 때 value_counts를 사용한다.shop_seoul['상권업종대분류명'].value_counts()
 plt.figure(figsize=(14, 10))sns.scatterplot(data = shop_seoul_edu, x='경도', y='위도', hue='상권업종대분류명') #hue는 분류기준이다.
 # 상권업종중분류명를 기준으로 보았을 때plt.figure(figsize=(14, 10))sns.scatterplot(data = shop_seoul_edu, x='경도', y='위도', hue='상권업종중분류명') #hue는 분류기준이다.
 # 학원 - 컴퓨터 데이터 뽑기
shop_seoul_edu_computer = shop_seoul_edu[shop_seoul_edu['상권업종중분류명'] == '학원-컴퓨터']
shop_seoul_edu_computer plt.figure(figsize=(14, 10))sns.scatterplot(data = shop_seoul_edu_computer, x='경도', y='위도', hue='상권업종소분류명') #hue는 분류기준이다.
 # folium으로 shop_seoul_edu_computer의 컴퓨터 학원 데이터 출력map = folium.Map(location=[37.56652479270633, 126.9779129116262], zoom_start=11)for _, row in shop_seoul_edu_computer.iterrows():popup = folium.Popup(row['상호명'], max_width=200)folium.Marker(location=[row['위도'], row['경도']], popup=popup).add_to(map)
map
# shop_seoul_edu_computer에 있는 각 row에 대해서# popup은 각 row의 상호명으로 하고# marker는 위도, 경도를 위치로 하고 이때 popup은 위에 설정한 것으로 한 채로 지도에 넣는다.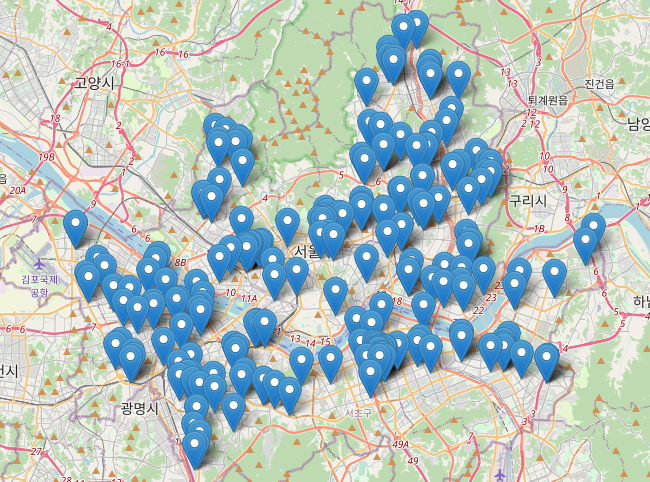
상권업종중분류명이 '커피점/카페'인 데이터 중 '구군'이 '강남구'인 데이터만 지도에 표기
# 상권업종중분류명이 '커피점/카페'인 데이터 추출
shop_seoul_cafe = shop_seoul[shop_seoul['상권업종중분류명'] == '커피점/카페']shop_seoul_cafe # '구군'이 '강남구'인 데이터 추출shop_seoul_cafe_gangnam = shop_seoul_cafe[shop_seoul_cafe['시군구명'] == '강남구']shop_seoul_cafe_gangnam
 data = shop_seoul_cafe_gangnamcafe_map = folium.Map(location = [data['위도'].mean(), data['경도'].mean()], zoom_start=12)
for i in data.index:cafe_name = data.loc[i,'상호명'] + '-' + data.loc[i, '도로명주소']popup = folium.Popup(cafe_name, max_width=500)folium.Marker(location=[data.loc[i, '위도'], data.loc[i, '경도']], popup = popup).add_to(cafe_map)
cafe_map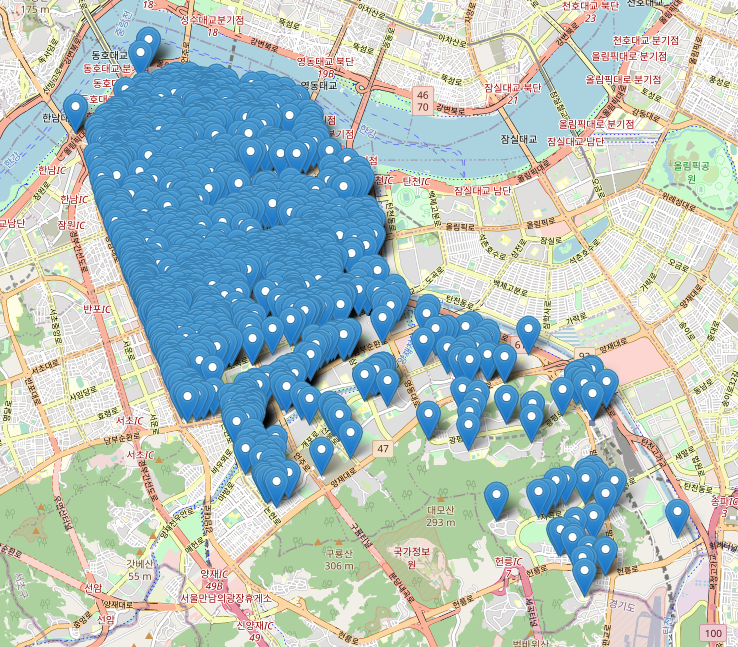
'데이터분석' 카테고리의 다른 글
(11) 데이터분석_따릉이 API를 이용한 프로젝트 (0) 2023.06.15 (10) 데이터분석_전국 도시공원 데이터 프로젝트 (0) 2023.06.15 (8) 데이터분석_folium (0) 2023.06.14 (7) 데이터분석_워드 클라우드 (0) 2023.06.14 (6) 데이터분석_형태소 분석 (0) 2023.06.13